Penalty Point Hotspots of GB: Where are our Most Reckless Drivers
The penalty point system in the UK was originally set up as a deterrent and punishment for dangerous and reckless driving. Points can be dished out for a mixed bag of offences, including driving under the influence, and using your phone while behind the wheel.
So, we thought it would be interesting to find out where the most reckless drivers in the country are and uncover which regions and city-centred postcode areas have accumulated the most points. Since our research revealed some interesting findings, it’s worth reading on to find out where the penalty hotspots of Great Britain are located.
How we did it
We took the Government driver’s licence penalty point data, which was split by the number of drivers with a certain number of points and did our own calculations to uncover the total amount of points held by regions in Britain.
We also uncovered age-specific data and took a closer look at regional licence-holder figures. Coupled further with speed camera data, we wanted to get a complete understanding of whether drivers are really more rebellious in these regions, or whether they’re just more likely to get caught.
Which Regions in Britain Have the Most Penalty Points?
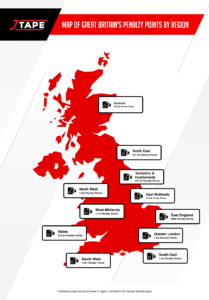
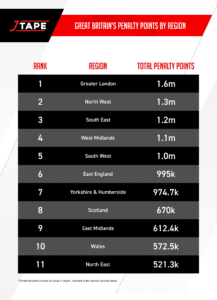
Greater London takes the top spot for the most penalty points, with a massive 1.6 million accumulated across the region. However, the North West isn’t far behind with over 1.3 million points.
On the other end of the spectrum, the North East had the least amount of penalty points, with just less than 521.3k points collected in the region.
Of all the Northern English regions, it seems that there are more reckless drivers in the North West with over 1.3 million points. Despite the North West having fewer licence holders than the South East, the North West still holds more penalty points.
When comparing the Midlands; the West has substantially more penalty points than the East (1.1 million compared with 612.4k).
Age Groups in Britain with the Most Penalty Points: Ranked

Taking a closer look at the age group splits – we uncovered some interesting results.
Perhaps surprisingly, 16–24-year-olds as a group had the least combined penalty points, with around 702k, followed by the 70+ group with more than 739.7k points.
However, 34–42-year-olds were the group with the most penalty points, with just under 2.2 million points collectively, followed by the 25–33-year-olds, with around 2 million.
According to the UK Government statistics, the highest proportion of drivers observed using a mobile phone behind the wheel are estimated to be 17-29-year-olds. Meanwhile, a much lower proportion is estimated to be 60 or older. This could be the reason behind the 25-33-year-old group’s penalty points.
Number of Points per Region vs. No. of Speed Cameras per Region
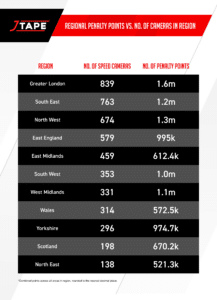
Since Greater London, the South East and the North West are the regions with the most speed cameras, the above chart poses an interesting question: are drivers more rebellious in regions with more points, or is it the case that they’re just more likely to get caught?
On the other hand, the East Midlands ranked much lower on the list in terms of penalty points, but high on the number of speed cameras in the region. This could suggest that drivers in the East Midlands are more sensible since there are more opportunities for them to be caught speeding.
Meanwhile, the North West had more points than the South East, despite having fewer fixed and mobile speed cameras. Could this mean that drivers are more reckless in this area because the chance they’ll be caught is lower?
Number of Points per Region vs. No. of Smart Motorways
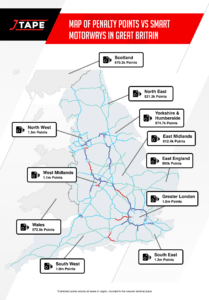
Smart motorways are slowly making their way into the different regions of Britain, with the majority located in the South East, London, Manchester, Birmingham, and Sheffield. And according to the map, there does seem to be a correlation between Smart Motorway locations and penalty point hotspots.
For example, Greater London has the most penalty points. Despite this largely being to do with the sheer size of the area, there is also a concentration of smart motorways in the area. Similar to Manchester in the North West – this area is also a smart motorway and penalty point hotspot.
Looking at the map, it seems that the more smart motorways there are in an area, the more points the region accumulates.
GB Cities with the Most Penalty Points
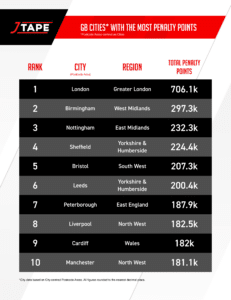
Unsurprisingly, the City of London takes the prize for being the biggest penalty point city in Great Britain, with almost 707k penalty points in the postcode area. Birmingham has the second-highest number of penalty points, although they’re still more than 297k behind.
Two North West city areas are placed in the top 10, with Liverpool coming eighth having just less than 182.5k points and Manchester being 10th with just over 181k points.
Two cities in Yorkshire and The Humber also feature in the top 10, with Sheffield at fourth with 224.4k points and Leeds at sixth with 200.4k points.
Looking at this list, it seems that many cities that are hotspots for Smart Motorways also have the most penalty points, which could suggest that there’s a link between the two.
GB Cities with the Least Penalty Points
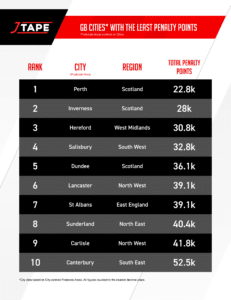
Perth in Scotland is the city area with the least penalty points, having just 22.8k under their belts. Coming in second place is another Scottish city – this time, Inverness – withjust 28k points. For the city in third place, we jump down to Hereford in the West Midlands, where they have a similar number of points with only 30.8k.
Interestingly, there were three Scottish city areas in the bottom 10 cities in terms of the number of penalty points. Meanwhile, the North West also had two cities in the list with the least points, with Lancaster and Carlisle featuring.
Which Areas in Britain have the Most Penalty Points?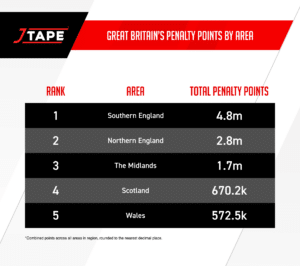
Combining Greater London, South East, South West & East of England – Southern England had the most penalty points when compared against other areas of GB, with more than 4.8 million penalty points.
This was followed by Northern England, as a combination of the North West, North East & Yorkshire/the Humber with more than 2.8 million points. The area still had nearly half the number of points than the south, which could suggest there are more careful drivers in the north.
Overview: Driver Penalty Point Numerical Splits by Region
Possibly unsurprisingly, Greater London also has the most drivers with 3, 6, 9 and 12 points on their licence. However, the North West wasn’t far behind in the 3-point category, with around 242.3k drivers holding 3 points on their licence, compared to Greater London with just under 244.1k.
The North West and Greater London were also very similar on drivers with 12 penalty points, with 950 North West drivers having this many compared with 1.1k in Greater London.
The North East had the least drivers across the 3 and 6-point categories, however, Scotland had the least drivers with 9 and 12 points. Could this mean that drivers are more careful in these regions? Or could it be that drivers are more deterred by the penalty points system in these areas?
At JTAPE, we offer a wide variety of automotive tapes for all different body shops and auto repair jobs. Visit our online store to discover our full product list, or contact us to find your local distributor.


